Understanding Page Speed Insights Metrics
Page Speed has always been an important part of how a website performs in the Search Engines and how usable customers perceive a website to be. It can also be a deciding factor on whether or not a user will convert or make a purchase on a website.
We’ve all been guilty at one point or another of exiting a really slow webpage and starting our search again…
Before we can effectively and sustainably optimise a website for Page Speed, we need to first understand what Google (and other search engines) look at when calculating your websites ‘score’ on the Page Speed Insights report. While we can clearly see what aspects are measured and reported on, it isn’t always clear what those metrics actually are and what they measure.
That’s why we’ve put together this guide – to help you understand the Page Speed Insight metrics, in order to help you make your website more user-friendly and more accessible to the end-user.
Largest Contentful Paint (LCP)
The Largest Contentful Paint is a key metric in the Page Speed Insights report and will actually play a key part in the May 2021 Google Algorithm Update, which we recommend you read up on if you haven’t already. You can download our complete guide to preparing for it here.

Simply Put: Largest Contentful Paint measures the amount of render time spent populating and visualising the largest image or text block within the viewport specified in your browser. All LCP is relative to when the page first started loading.
First Contentful Paint (FCP)
Generally speaking, the term First Paint refers to the exact second that ANYTHING is rendered on your browser. You will typically see the First Paint being a header/banner image right at the top of the page you are trying to load or even just the background colour of the page in question. ‘Painting’ a banner image or page background first is a great way to give the impression of a fast-loading page.

However, there is another level to First Paint… First Contentful Paint. First Contentful Paint (FCP) is much more effective at holding your page speed to account. It measures the amount of time it takes for the first piece of actual content (whether this is text/copy or visual assets) to be visible on your browser.
Simply put: FCP is the point at which content that your user can engage with or benefit from becomes visible.
Time To Interactive (TTI)
Time to Interactive is another Page Speed metric that is incredibly important, not only to Search Engines but equally (if not more so), to the user. Time to Interactive means (as you would expect), the time it takes for a web page to become fully interactive.
‘Interactive’ can be quite subjective when it comes to SEO and Page Speed, however, Google defines Time To Internative (TTI) using 3 criteria:
- The web page has rendered and displayed useful content (see First Contentful Paint section)
- Event handlers have successfully been registered for most/all visible page elements
- The page now responds quickly and effectively to user interactions, typically within 50milliseconds.
How to Interpret Time to Interactive
The below table highlights how the Page Speed Insights Report measures and ‘scores’ your TTI:

Simply put: Time To Interactive is the point where your users can view, navigate and engage with your site/web-page without experiencing any issues or delay.
Speed Index
Speed Index is relatively easy to understand (this is an anomaly in the world of SEO, where everything is usually mind-blowingly complex). Google defines the Speed Index of your site to be the amount of time (measured in seconds) that the content on your web page/site takes to become visually populated.
When calculating the Speed Index of a web-page, Google benchmarks the Speed Index score (which they obtain using the Speedline Node.js module) against the data from the HTTP Archive.
How Page Speed Insights Categorises Speed Index:

Total Blocking Time
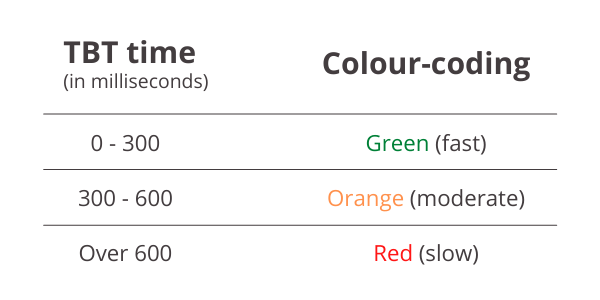
This metric of the Page Speed Insights report measures the amount of time (in seconds) that a web page is blocked from responding to user input. These kinds of user inputs include mouse clicks, keyboard presses or screen taps etc.
Total Blocking Time is calculated using the sum of all ‘Long Tasks’ between the points of FCP and TTI. Any task beyond 50ms is considered a ‘Long Task’ and the Total Blocking time is calculated after this point, so if a task takes 70ms the TBT would be 20ms.
Cumulative Layout Shift (CLS)
CLS is, again, going to play a key part of CWV Algorithm Update in May 2021 (and again, we encourage you to learn more about this via our guide). A layout shift occurs every time a visible element moves or shifts suddenly from one frame to another.

Have you ever gone to click something on a webpage, and just before you do… the whole page (or at least most of it) moves suddenly… and you end up clicking the wrong thing? We’ve all been there… and it’s called Cumulative Layout Shift.
Simply Put: Cumulative Layout Shift is the sum of all unexpected and sudden layout shifts that occur during the lifespan of a webpage during a user’s sessions.
If you have never run a page speed test, you can do so for free here. Need help improving your Page Speed scores? Struggling to improve the usability of your site? Our teams of experts would be happy to help! Get in touch today.

With over 5 years of Digital Marketing experience, Senior Account Manager and Team Leader Elliot has a keen interest in ‘SEO hacks’ and client relations