How to Improve Core Web Vitals for SEO
Core Web Vitals are a series of metrics designed to assess the performance of your website in terms of user experience. They can be in relation to the load speed and changes to the layout, as well as the responsiveness and accessibility of your site. Keep reading to find out what Core Web Vitals are, why they are important for SEO and how you can improve them!
What are Core Web Vitals?
Essentially, Core Web Vitals are a collection of metrics designed to measure different user experience aspects of your site. The data is taken from both desktop and mobile over a 28-day collection period.
Why are Core Web Vitals important?
Aside from topical relevance, Google’s priority is, and will continue to be, user experience. In this vein, Core Web Vitals are important as they relate directly to the user’s interaction with your webpage. They offer insights into potential pain points and reasons for metrics such as a higher bounce rate on certain pages, or on the site as a whole.
Do Core Web Vitals performance scores directly impact SEO?
While Core Web Vitals performance scores (such as SEO 50, for example) do not directly affect SEO, the metrics within them do. Essentially, the metrics themselves (LCP etc) evaluate user experience, and user experience directly affects SEO. The aim of the assessment is to give you actionable advice that will help attract and retain users on your site.
How do you analyse Core Web Vitals?
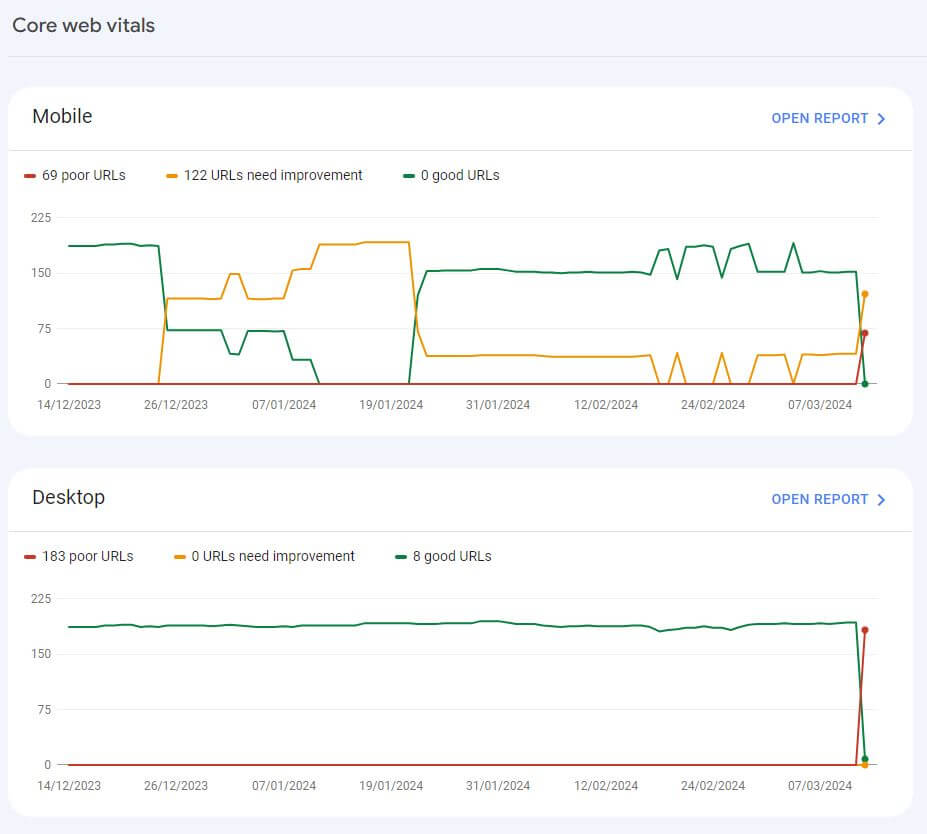
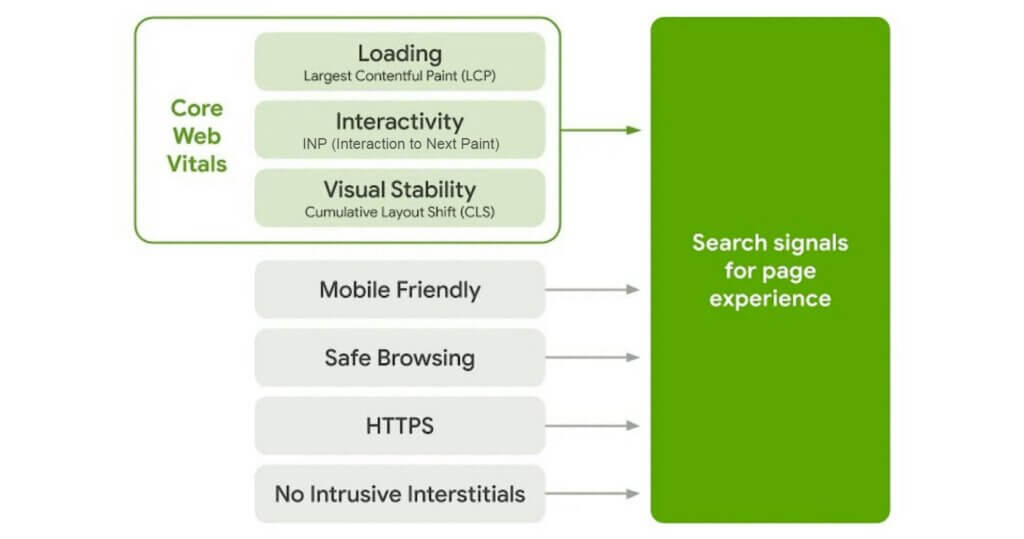
Core Web Vitals hints can be found on Google Search Console, under the page experience section for the 3 key metrics:
- LCP (Largest Contentful Paint)
- CLS (Cumulative Layout Shift)
- FID (First Input Delay)
However, for more-detailed insights from Google, you can also access PageSpeed Insights. PSI is a free user experience report for both desktop and mobile, providing suggestions on an individual page or site average-related basis. The data is collected from the previous 28 days. If there is not sufficient data, this is likely due to a lack of user visits. It could also be to do with the page being new.
What do the “estimated savings” mean?
Estimated savings relate to all of the different processes associated with loading the page. So when you see “estimated saving of 7 seconds”, this does not necessarily mean that your page takes 7+ seconds in its initial load. Instead, it relates to all elements of the page loading, broken down into their individual processes.
Key Core Web Vitals metrics & how to improve them
The main Core Web Vitals metrics are as follows:
- LCP (Largest Contentful Paint)
- CLS (Cumulative Layout Shift)
- FID (First Input Delay)
- First Contentful Paint (FCP)
- Interaction to Next Paint (INP)
- Time to First Byte (TTFB)
If you think that this just looks like a list of incredibly confusing technical terms, you are not alone. That is why we are here to help – we have broken down each individual metric and simplified it to help you understand what it is, how it affects your site and how to fix it.
What is LCP?
LCP, or Largest Contentful Paint, references the largest image, video or block of text that is visible within the viewport (display window). It reports the time it takes to render the resource (make it visible), relative to when the page first started to load.
An ideal LCP score is 2.5 seconds or less; anything between 2.5 and 4 seconds is classed as needing improvement. Anything above 4 seconds is considered poor.
Improving your LCP means your website will load faster, meaning that users can interact with it more quickly. This can help you decrease bounce rate and rank higher, as Google values good user experience. In turn, this will help improve conversion rates, as users are more likely to stay on the site.
How to fix LCP issues
In order to fix LCP issues, you first need to use resources such as PageSpeedInsights to find out which element is causing the problem.
Ideally, you want your LCP resource request to start loading as early as possible, and the element to render as quickly as possible.
The LCP process can be broken down into the following stages:
- TTFB (Time To First Byte) – the time from when the page begins loading, until when the browser receives the first byte of the HTML document response.
- Resource load delay – the amount of time it takes a resource (image, script etc) to start loading after the page requests it.
- Resource load time – the time it takes for a resource to be fully loaded.
- Element render delay – The delay between when the LCP resource finishes loading and the LCP element (the image etc itself) is fully rendered.
It is important to optimise all four parts. This is because in some cases, the time saved in one part will shift to the others if they are not also optimised.
An example of this is: if you reduced the file size of an image by compressing it, this would reduce the resource load time. However, the time would instead shift to the element render delay portion.
1. Eliminate resource load delay
For this aspect, you should aim to make sure your LCP resource starts loading at the same time as the first resource loaded by the page. To do this, your resource should be discoverable from the initial HTML response. This means that when you request a web page, the information about elements to be loaded or displayed should be mentioned in the first set of instructions given to the browser. Essentially, it is like having a list of everything you need for a task, so you can gather everything before you get started.
However, this is not possible when:
- The LCP element is a <img> that is dynamically added via JavaScript.
- The element is lazily loaded with a JavaScript library that hides its src or srcset attributes (likely as data-src or data-srcset) – this means that it is set up to load when it is needed, and this is managed using a JavaScript program.
- The LCP element needs an image displayed as its background using CSS.
In these cases, the resource should be preloaded, with a high fetch priority.
Optimising resource priority
Sometimes, the browser’s preload scanner (a tool that gets pages prepared so that they load faster when you need them) does not recognise that your resource is important, or as important as others. This means that it still may not start loading as early as the first resource.
You can tell your browser which resources are the most important using the fetchpriority attribute. For example, it is a good idea to set fetchpriority=”high” on an <img> if it is your LCP element.
Make sure the LCP resource is hosted on the same origin
If it is hosted on a different origin (website), this request requires the browser to connect to that origin before it can start loading the resource.
2. Eliminate element render delay
Ideally, the element should render immediately after the resource has finished loading. The main reason for it being unable to do this is if it is blocked. This could be due to the fact that:
- The resource has finished loading, but the LCP element is waiting for some synchronous scripts or stylesheets in the <head> to load (the resource is ready, but it is waiting for scripts or styles to finish loading before it can load).
- Rendering (display) of the whole page is blocked due to synchronous scripts or stylesheets in the <head> that are still loading.
- The element is being hidden by other code.
- Long tasks are blocking the main thread (main part of the webpage), and rendering work needs to wait until after they are finished.
Reduce or inline render-blocking stylesheets
Stylesheets loaded from the HTML markup will block the rendering of all content that follows them, which is normally positive. However, if the stylesheet is so large that it takes longer to load than the LCP resource, it will stop it from rendering.
To fix this, you can:
- Inline the stylesheet into the HTML (only suitable if your stylesheet is small). This means instead of having a separate file for the style of your page, it is directly in the page code.
- Reduce the stylesheet’s size so that it is smaller than the LCP resource (preferred).
To reduce the size of the stylesheet, you can:
- Remove unused CSS (CSS that is not being used and can be removed or deferred).
- Defer non-critical CSS (split the stylesheet into styles needed for initial page load and ones that can be lazy-loaded).
- Minify and compress CSS – this means making the style code smaller by removing unnecessary characters.
Defer or inline render-blocking JavaScript
Generally, it is not necessary to have scripts without the async or defer attributes in the <head> section of your pages. This is likely to negatively affect page performance.
Instead, inline script contents directly into the HTML (only if they are very small scripts).
Use server-side rendering
Essentially, SSR means that the server generates a fully formed version of the page including content, before sending it to the browser.
- Your image resources will be discoverable from the HTML source (it is easier to see where images are located on the page by looking at the page’s code).
- Page content will not need additional JavaScript requests (the webpage can display quickly without needing to wait for extra code).
3. Reduce resource load time
To reduce the time spent transferring the bytes of the resource to the user’s device, you can:
- Make the size of the resource smaller, using compression, modern image formats or reducing the web font size.
- Make the distance it has to travel before reaching them smaller – this means making sure your servers are as geographically close to your users as you can.
- Reduce contention for network bandwidth (helping data be sent and received more efficiently over the internet). This can be done by limiting the number of resources loading at the same time.
- Eliminate the network time – reducing the time it takes for data to travel from the server to your computer using the internet.
4. Reduce time to first byte
Essentially, the ideal outcome is to deliver the initial code as quickly as possible. A slow TTFB can be attributed to factors such as:
- Multiple redirects before you reach the final URL.
- When cached content cannot be used from a CDN edge server, meaning requests have to be directed back to the origin server. This means that the copy of the content is not stored close to you, and instead has to travel back to the original source server.
What is FID (First Input Delay)?
First Input Delay measures the interactivity and responsiveness associated with a user’s first interaction with a page. Essentially, when a user interacts with a page (clicks a link or a button etc), FID measures how long it takes the browser to respond to that interaction (make the response happen).
An ideal FID score is 100ms. Anything between 100-300ms is considered in need of improvement; anything above 300ms is considered poor.
It generally occurs if the browser is busy doing something else, such as executing a large JavaScript file. This means that the page has rendered some of its content, but is not yet ready to be interactive.
How to fix FID issues
To help reduce the delay when a user interacts with the site, you can:
- Break up long tasks in the code into smaller parts, so that they do not delay responses to user interactions.
- Optimise the page for interaction readiness, through loading content server-side or progressively loading code and features.
- Minimise cascading data fetches: avoid long chains of data fetching to speed up webpage response.
- Reduce data processing on the user’s device – minimise the amount of data that needs to be processed by the device after it is received.
- Reduce third-party scripts – these include analytics or tags that keep the network busy, blocking the main thread. Potentially look into on-demand loading of third-party code (i.e. only when it is needed).
- Prioritise loading more important code than third-party code.
What is INP (Interaction to Next Paint)?
Essentially, INP is the metric that will be replacing FID (First Input Delay) in the Search Console Core Web Vitals section. This change came into effect in March 2024.
It aims to measure the responsiveness of all user inputs on a page, not just the first one (which was the focus of FID). It will also aim to capture the full duration of an event, instead of just accounting for the delay time.
An INP below 200ms suggests that your page is responsive, with 200-500ms suggesting a need for improvement.
How to fix INP issues
INP is made up of three stages, which are:
- Input delay – this starts when the user interacts with the page, and ends when the actions related to the event stop happening.
- Processing time – how long it takes the tasks associated with the command to finish.
- Presentation delay – how long it takes the browser to show the visual result of the interaction.
These three phases come together to make up what is called the total interaction latency; you can optimise each of these different parts to reduce the latency.
Once you have used a tool like PageSpeed Insights to determine the slow interaction(s) on the page, you can then try solutions such as:
Identify and minimise input delay
Higher levels of input delay can be caused by main thread activities, such as scripts loading, and fetch handling (handling data gathered from a source such as a server or website). It can also occur in response to overlapping interactions that happen in quick succession. To reduce it, you should:
- Avoid recurring timer functions in third-party JavaScript code that create excessive thread work, such as setTimeout and setInterval.
- Avoid long tasks – it can help to break them up so they have to do as little work on the main thread as possible.
- Avoid interaction overlap – this means that when you have interacted with an element, you make another interaction before the first one has had a chance to visually display. To solve this, you should consider debouncing inputs (preventing too many fast responses to interactions). You could also use AbortController to cancel requests that take too long to complete and slow down the main processes.
What is CLS (Cumulative Layout Shift)?
CLS relates to unexpected layout shifts on a website. For example, if you are scrolling and there is a sudden change to the page, like an unwanted scroll or a moving button. It is vital to avoid this from a user experience perspective, as it is more likely to increase the bounce rate of any page where these issues are present.
Generally, CLS happens as a result of resources being loaded asynchronously (multiple tasks being done at the same time, instead of waiting in line for each to finish).
It can also happen as a result of DOM elements being dynamically added to the page above existing content (text, images etc being inserted on top of what was already there, putting a new layer on an existing one).
The most common causes are:
- Images without dimensions
- Web fonts
- Ads, embeds and iframes without dimensions
A good CLS score is 0.1 or less; anything between 0.1 and 0.25 is classed as needing improvement, with anything above 0.25 being classed as poor.
How to fix CLS issues
Once you have identified the source of the layout shifts, you should:
- Always include width and height size attributes on any video and image elements. This will help the browser give it the right amount of space whilst loading.
- Statically reserve space for late-loading content in the initial site layout. You can use min-height styling to reserve space, or for responsive content like ads, you can use aspect-ratio (CSS). If the element was given by a third-party, you should account for slight differences. However, this will add extra blank space.
- Alternatively, you could set the initial size to the smallest that will be used, and allow some shift for larger content, using min-height to reduce CLS to a more manageable level.
- Avoid putting late-loading content near the top of the viewport (what users can see on their screen). This is because elements at the top normally have more content lower down, causing more movement.
- Avoid inserting new content that is not prompted by a user interaction. These include popup elements, such as sign-up prompts or “install our app”. When these are used, you should reserve the space for them in the viewport in advance, using a placeholder or skeleton UI. Alternatively, you could make sure the element is not part of the document flow by overlaying the content (if appropriate)
What is FCP (First Contentful Paint)?
First Contentful Paint relates to the time between when the page starts loading, and then any part of the page’s content (images, text etc) appears on the screen.
Anything below 1.8s is considered a good FCP score, with 1.8-3 seconds needing improvement, and anything above 3 seconds being poor.
How to fix FCP issues
To fix FCP issues, you can try the following:
- Eliminate render-blocking resources
- Minify CSS
- Keep request counts low & transfer sizes small – decrease the number of separate requests your site makes when loading content. This means it does not have to fetch as many resources from the server
- Make sure text stays visible during webfont load – when you are using custom fonts, text should immediately be visible and readable to users even as the webfont is loading. This helps to prevent delays
- Minimise critical request depth – reduce the number of steps needed to load the most essential elements of the page before it can be displayed to the user
- Remove unused CSS
- Remove unused JavaScript
- Preconnect to required origins – connecting early to the servers or sources your web page loads its resources from
- Reduce server response times (TTFB)
- Avoid multiple redirects
- Avoid enormous network payloads
- Preload key requests
- Avoid an excessive DOM size
What is Speed Index?
Essentially, Speed Index measures how fast content is displayed visually during page load.
Between 0 and 3.4 seconds is classed as being fast, with 3.4-5.8 seconds being moderate, and anything over 5.8 being classed as slow.
How to fix Speed Index issues
In order to fix your Speed Index, you should take a look at the following issues:
- Minimising main thread work
- Reducing JavaScript execution time
- Making sure text remains visible during webfont load
What is Total Blocking Time?
Total Blocking Time (TBT) relates to how long a page becomes unresponsive when you are trying to use it. A lower total blocking time indicates a faster, and therefore more user-friendly, page.
This happens when the main thread is blocked by a long task for more than 50ms (this is because the browser cannot interrupt a task that is in progress).
Your site should have a total blocking time of less than 200ms on the average mobile.
How to fix Total Blocking Time
You can fix Total Blocking Time by looking at issues such as:
- Reducing the impact of third-party code
- Keeping request counts low and transfer sizes small
- Minimising main thread work
- Reducing JavaScript execution time
What is Time to Interactive?
TTI is the amount of time it takes for your page to become fully interactive. This is when:
- The page shows useful content (measured by First Contentful Paint)
- Event handlers are registered for most visible elements
- The page responds to user interactions within 50ms
A score of between 0 and 3.8s is considered fast, with 3.9-7.3 being moderate, and anything over 7.3 being slow.
How to fix Time to Interactive
Deferring or removing unnecessary JavaScript can have a huge impact on TTI. You can also improve TTI by minimising main thread work and reducing JavaScript execution time.
What is the difference between TTI and FID?
While TTI relates to the amount of time it takes your page to become fully interactive to all inputs, FID describes the time it takes for the page to respond to the first user interaction.
Tips for Shopify Core Web Vitals
- Using heavy themes and fonts will give the browser more complex code to handle when loading the site.
- A lot of Shopify themes come with carousels and sliders. However, these can cause issues in relation to mobile responsiveness, and multiple images can increase load time. Additionally, it can lower your click-through-rate, due to users having to make extra clicks to get to what they want. You should instead consider a static hero image layout to increase conversions and speed up your homepage.
- Installing extra apps or scripts on Shopify, such as tracking apps, can contribute to delay, as the site has to load extra third-party code. You should instead use Google Tag Manager to centralise your tracking efforts.
- Avoid using GIFs, opting instead for optimised static images.
- Image compression is key in ensuring that browsers can load the content of your page faster. You should also make sure that images are explicitly sized to avoid layout shifts.
What is the best website builder for Core Web Vitals?
The more options for bespoke customisation, the easier it is to optimise your site for Core Web Vitals and user experience. However, there are fixes such as image compression and using static images over carousels that can help optimise a website on a more restrictive CMS. Ultimately, it is incredibly unlikely that you will pass all Core Web Vitals tests, so we would not recommend aiming for this. Instead, you should aim for the best possible user experience within the limitations of your CMS.
We can help you prioritise key tasks and make recommendations to improve your user experience. Find out how our technical SEO services could help your business, or get in touch directly with our expert team here.

Carla is an SEO Account Manager with a background in all things SEO and Digital Marketing, and a passion for Technical SEO.